The Aboriginal and Torres Strait Islander community of Australia is diverse and comprised of a wide range of cultural groups speaking many different languages.
The following data is derived from the 2021 Census:
| State/Territory | Aboriginal | Torres Strait Islander | Both Aboriginal and Torres Strait Islander | Proportion of total population of State/Territory |
|---|---|---|---|---|
| New South Wales | 267,067 | 5,127 | 5,844 | 3.44 |
| Victoria | 61,865 | 2,083 | 1,692 | 1.01 |
| Queensland | 193,405 | 21,772 | 22,122 | 4.60 |
| South Australia | 40,592 | 994 | 967 | 2.39 |
| Western Australia | 85,004 | 1,625 | 2,068 | 3.33 |
| Tasmania | 27,738 | 1,225 | 1,229 | 5.41 |
| Northern Territory | 58,566 | 692 | 1,852 | 26.27 |
| Australian Capital Territory | 8.425 | 230 | 300 | 1.97 |
| Other Territories | 212 | 6 | 6 | 4.68 |
| Australia | 742,882 | 33,765 | 36,083 |
Source: Australian Bureau of Statistics 2021, Customised tables
The birthplace of overseas-born residents gives some indication of the diversity of ethnicity of a population. When Australian born residents with one or both parents born overseas are combined with overseas born, a fuller picture of cultural diversity emerges.
The following data is derived from the 2021 Census:
| Country | Persons | % Total population |
|---|---|---|
| Australia | 17,019,815 | 66.9 |
| England | 927,490 | 3.6 |
| India | 673,352 | 2.6 |
| China (excludes SARs and Taiwan) | 549,618 | 2.2 |
| New Zealand | 530,492 | 2.1 |
| Philippines | 293,892 | 1.2 |
| Vietnam | 257,997 | 1.0 |
| South Africa | 189,207 | 0.7 |
| Malaysia | 165,616 | 0.7 |
| Italy | 163,326 | 0.6 |
| Sri Lanka | 131,904 | 0.5 |
| Nepal | 122,506 | 0.5 |
| Scotland | 118,496 | 0.5 |
| Korea, Republic of (South) | 102,092 | 0.4 |
| United States of America | 101,309 | 0.4 |
| Germany | 101,255 | 0.4 |
| Hong Kong (SAR of China) | 100,148 | 0.4 |
| Iraq | 92,922 | 0.4 |
| Greece | 92,314 | 0.4 |
| Pakistan | 89,633 | 0.4 |
| Lebanon | 87,340 | 0.3 |
| Indonesia | 87,075 | 0.3 |
| Thailand | 83,779 | 0.3 |
| Ireland | 80,927 | 0.3 |
| Iran | 70,899 | 0.3 |
| Fiji | 68,947 | 0.3 |
| Netherlands | 66,481 | 0.3 |
| Singapore | 61,056 | 0.2 |
| Afghanistan | 59,797 | 0.2 |
| Bangladesh | 51,491 | 0.2 |
Source: Australian Bureau of Statistics 2021, Customised tables
| New South Wales | Victoria | Queensland | South Australia | Western Australia | Tasmania | Northern Territory | Australian Capital Territory | Other Territories |
|---|---|---|---|---|---|---|---|---|
| China (excludes SARs and Taiwan) | India | New Zealand | England | England | England | Philippines | India | Norfolk Island |
| England | England | England | India | New Zealand | China (excludes SARs and Taiwan) | England | England | New Zealand |
| India | China (excludes SARs and Taiwan) | India | China (excludes SARs and Taiwan) | India | Nepal | India | China (excludes SARs and Taiwan) | Malyasia |
| New Zealand | New Zealand | China (excludes SARs and Taiwan) | Vietnam | South Africa | India | New Zealand | Nepal | England |
| Philippines | Vietnam | Philippines | Italy | Philippines | New Zealand | Nepal | New Zealand | Philippines |
| Vietnam | Philippines | South Africa | Philippines | Malaysia | Philippines | China (excludes SARs and Taiwan) | Philippines | Singapore |
| Nepal | Sri Lanka | Vietnam | New Zealand | China (excludes SARs and Taiwan) | Scotland | Indonesia | Vietnam | Fiji |
| Lebanon | Italy | Scotland | Scotland | Scotland | Netherlands | Vietnam | United States of America | Sudan |
| Iraq | Malaysia | Germany | Germany | Italy | South Africa | Sri Lanka | Sri Lanka | India |
| Korea, Republic of (South) | Greece | United States of America | Malaysia | Ireland | Germany | United States of America | Pakistan | United States of America |
Source: Australian Bureau of Statistics 2021, Customised tables
A person’s ancestry, when used in conjunction with the person’s birthplace, language, religion and birthplace of their parents, provides a good indication of their ethnic background. This is particularly useful for identifying distinct cultural groups such as Maoris and South Sea Islanders and groups which are spread across countries such as Kurds or Indians. In the 2021 Census, respondents were asked to mark their ancestries back as far as two generations. Respondents were asked to report at least one ancestry, but no more than two.
The following data is derived from the 2021 Census:
| Ancestry (1st Response) | Both parents born overseas | Father only born overseas | Mother only born overseas | Both parents born in Australia | Not stated – birthplace for either or both parents not stated | Total |
|---|---|---|---|---|---|---|
| English | 1,813,759 | 741,426 | 562,591 | 5,057,707 | 75,956 | 8,251,447 |
| Australian | 210,308 | 392,221 | 334,854 | 3,689,587 | 52,199 | 4,679,172 |
| Irish | 239,150 | 97,246 | 66,587 | 881,283 | 8,655 | 1,292,913 |
| Chinese | 1,200,378 | 17,367 | 30,925 | 27,755 | 6,937 | 1,283,364 |
| Scottish | 211,508 | 95,828 | 71,259 | 510,166 | 6,302 | 895,058 |
| Italian | 411,573 | 91,152 | 38,328 | 274,234 | 5,432 | 820,715 |
| Australian Aboriginal | 5,406 | 32,617 | 17,859 | 653,213 | 11,070 | 720,165 |
| Indian | 669,050 | 3,466 | 2,730 | 1,742 | 1,430 | 678,417 |
| German | 171,261 | 34,531 | 25,200 | 198,626 | 4,134 | 433,756 |
| Filipino | 306,440 | 2,119 | 4,138 | 1,626 | 1,587 | 315,916 |
| Greek | 200,400 | 23,036 | 12,049 | 56,036 | 2,039 | 293,559 |
| Vietnamese | 264,784 | 2,360 | 2,890 | 2,146 | 1,401 | 273,579 |
| Lebanese | 130,804 | 20,251 | 9,837 | 18,938 | 894 | 180,722 |
| Dutch | 116,120 | 7,925 | 4,483 | 15,624 | 1,146 | 145,302 |
| Nepalese | 128,981 | 65 | 117 | 38 | 477 | 129,676 |
| Korean | 118,206 | 594 | 821 | 1,102 | 405 | 121,132 |
| Polish | 84,968 | 4,459 | 3,092 | 9,339 | 729 | 102,579 |
| Croatian | 76,602 | 5,800 | 3,321 | 11,378 | 843 | 97,943 |
| Maltese | 66,091 | 6,706 | 3,797 | 16,461 | 781 | 93,839 |
| Pakistani | 83,317 | 741 | 427 | 169 | 215 | 84,871 |
| Macedonian | 66,213 | 5,494 | 3,263 | 8,567 | 527 | 84,069 |
| South African | 75,696 | 1,254 | 800 | 614 | 309 | 78,676 |
| Sri Lankan | 70,332 | 935 | 555 | 719 | 287 | 72,830 |
| Serbian | 60,854 | 3,288 | 2,223 | 3,151 | 485 | 70,001 |
| Iranian | 68,376 | 358 | 254 | 134 | 287 | 69,401 |
| Turkish | 57,333 | 4,462 | 2,570 | 3,462 | 382 | 68,205 |
| Maori | 60,662 | 2,775 | 1,967 | 1,244 | 767 | 67,412 |
| New Zealander | 56,589 | 2,420 | 1,673 | 1,331 | 671 | 62,685 |
| Punjabi | 61,195 | 178 | 157 | 42 | 158 | 61,736 |
| Thai | 59,792 | 218 | 866 | 308 | 394 | 61,570 |
| Samoan | 56,148 | 2,075 | 1,230 | 652 | 669 | 60,782 |
| Other | 1,975,529 | 54,128 | 36,561 | 103,252 | 17,525 | 2,187,145 |
| Not stated | 143,752 | 12,982 | 10,471 | 112,954 | 1,304,004 | 1,584,164 |
Source: Australian Bureau of Statistics 2021, Customised tables
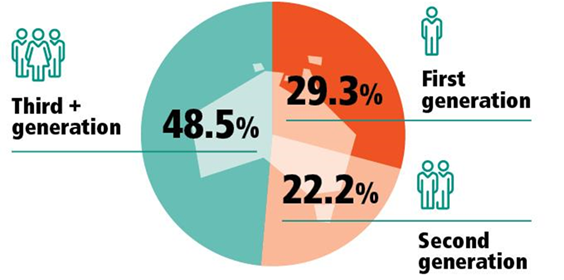
The pie chart shows that 29.3 per cent of the people living in Australia were born overseas, 22.2 per cent of people living in Australia who were Australian born have one or both parents born overseas and 48.5 per cent of people living in Australia who were Australian born have both parents born in Australia.
The information in this section is sourced from the Australian Government, Department of Home Affairs – Refugee and humanitarian program. Please visit Roads to Refuge for further information and education materials.
Refugees and people seeking residency in Australia for humanitarian reasons make up an important component of Australia’s overall migrant intake. The Humanitarian Program assists people affected by international crises including refugees and other people suffering human rights violations.
Since the end of World War II, over 920,000 refugees and people in humanitarian need have been resettled in Australia including people from Eastern Europe, South East Asia, Central America, the Middle East and Africa.
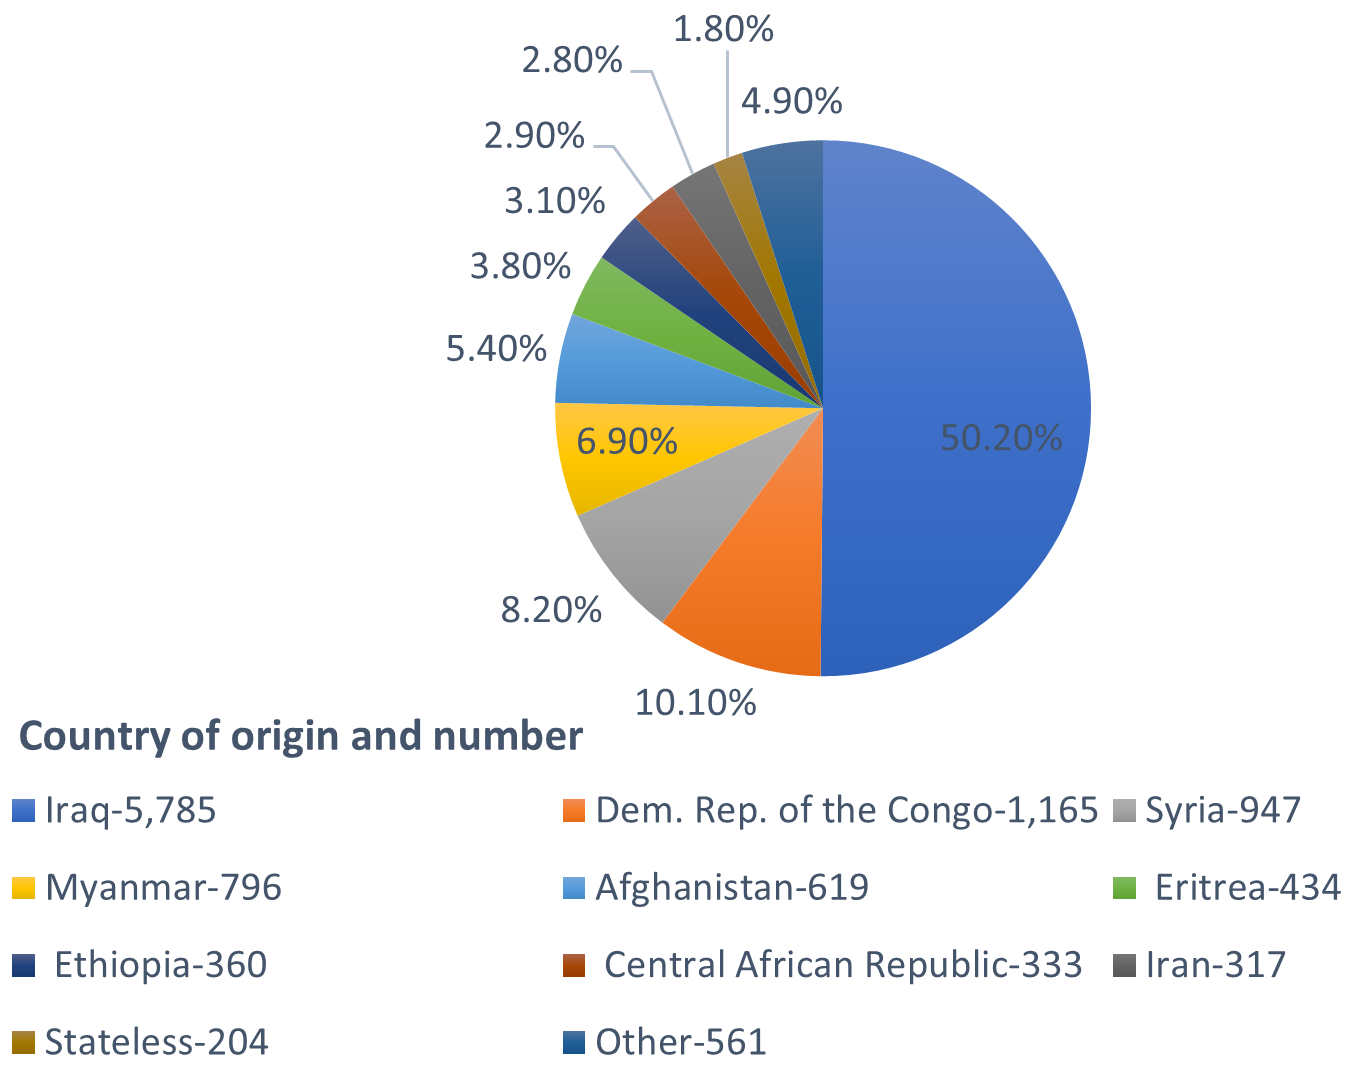
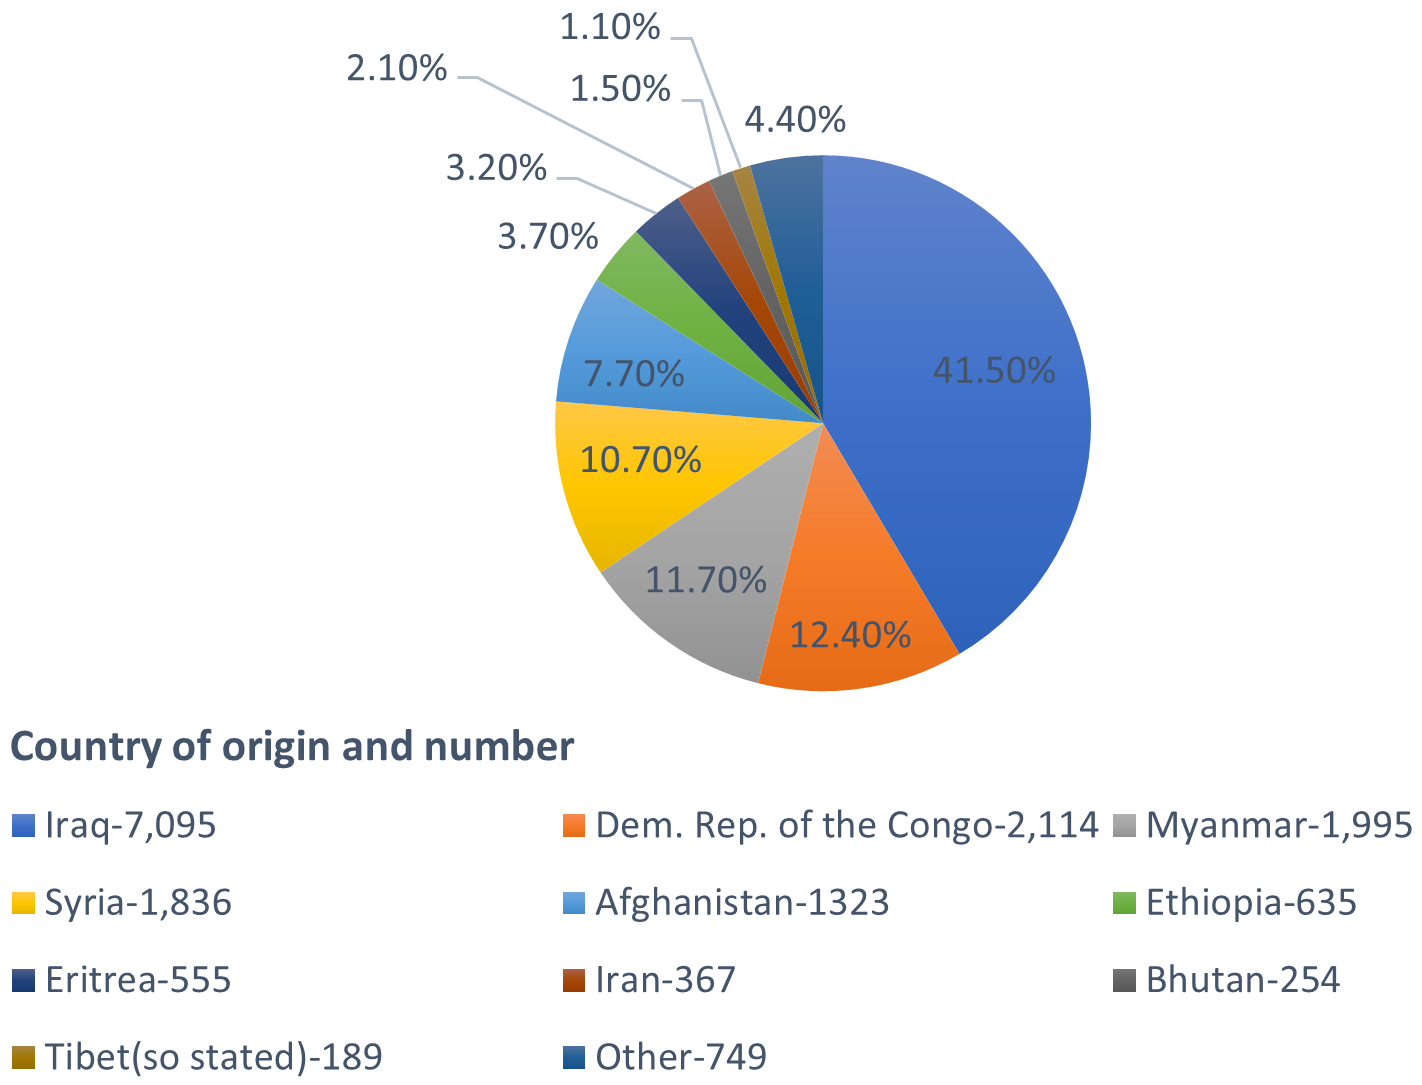
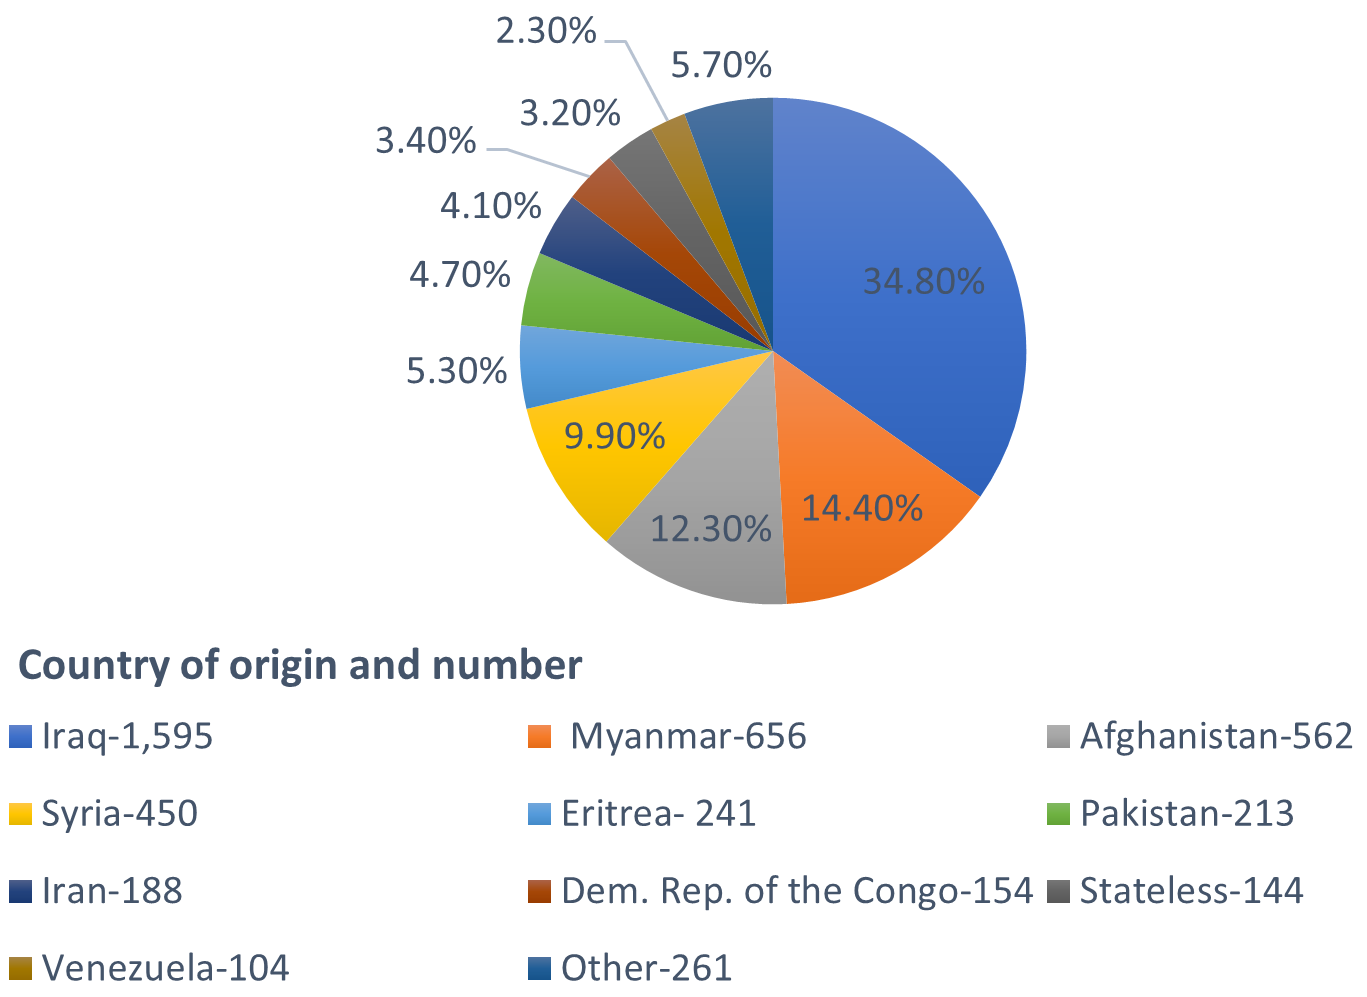
In 2020 – 2021:
Source: Australia’s Offshore Humanitarian Program: 2020-21 (8)
Notes: